How to measure guitar dead spots and find the cause
You can find a dead spot by ear: play up a string and notice the note that dies early. What your ear does not tell you is whether that note is the only one, whether it is a dead spot at all or just a weak pluck, and what is causing it. For that you need every note of the fretboard measured the same way, and a look at how the neck itself rings.
This is how to do both in Fretoscope, using one guitar as the example: a Harley Benton SC-450 Plus, a single-cut, scanned and tapped on the same evening. Why dead spots exist at all is in the companion article, Guitar dead spots live on your neck’s resonances.
What you need
- the guitar, in tune, with strings that are not dead themselves;
- an audio interface and a cable for the scan: an electric guitar has to be plugged in, a microphone will not do;
- a phone for the tap: the tap is recorded with its microphone (a studio microphone on the audio interface works too, see below);
- something to mute the strings with: a felt-lined string damper or a folded cloth, and a couple of rubber bands for the string ends on the headstock;
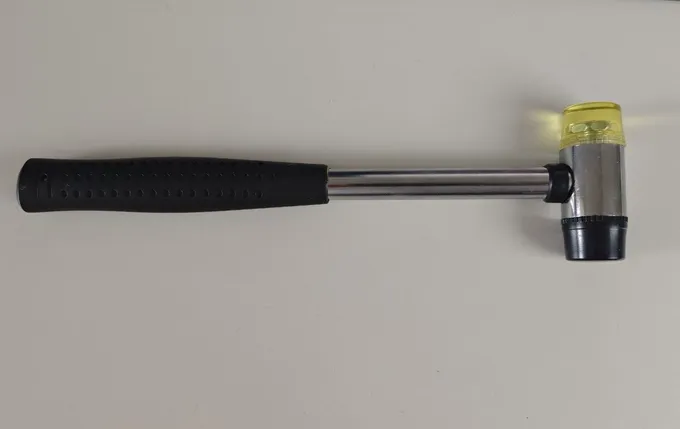
- a small hammer for the tap. We use a luthier’s fret hammer, the kind with a plastic and a rubber face; the plastic handle of a screwdriver also works. A finger or a knuckle is too soft;
- about an hour for the scan and ten minutes for the taps.
Step 1: scan the whole fretboard
Open Fretboard Scanner in the Workshop. Plug the guitar into the audio interface, pick the neck pickup alone, and keep the signal clean: no amp model, no drive, no pedals. Press Record and drag the threshold marker on the Input Level meter to just above the noise floor.

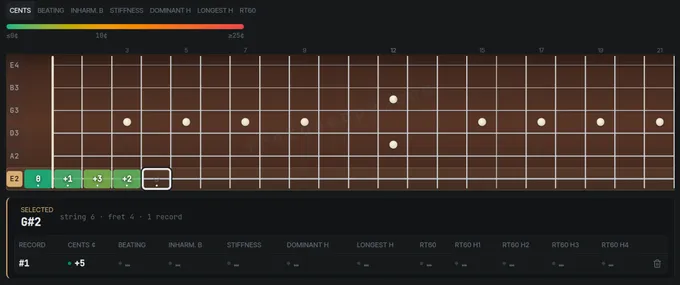
Then play the fretboard one note at a time. Select a string by its tuning note left of the nut, pluck the open string, and hold the note while the spinner shows on that position: the scanner needs the whole decay, not just the attack. Wait until the spinner is gone and the computed values appear in the panel below, then move up a fret. Do every string up to the last fret.
A few things make the result easier to read:
- Pluck the same way every time: the same spot over the pickups, the same pick, the same strength.
- Let it ring. A note cut short by your hand reads as a short note.
- Pluck a note more than once if you have the time. It helps, but it is not required: one pluck per note is already enough to see the trend and the dead spots that fall out of it. The scanner keeps every pluck for a position and averages them, so extra plucks make each number steadier and keep a single weak pluck from passing for a dead note.
Step 2: read the sustain map
When the scan is done, switch the fretboard view to RT60, then Overall and Compensated.
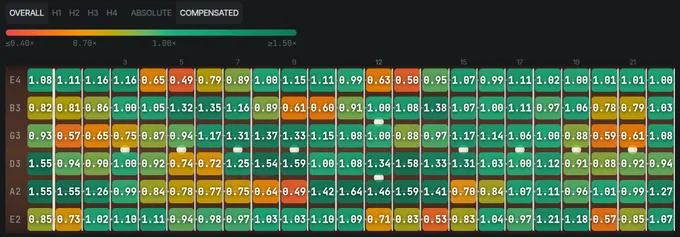
Absolute shows how many seconds each note rings, and that alone is hard to read: low strings ring longer than high ones, and every string rings shorter as you go up the neck. That is normal, it is how strings work, not a fault of the guitar: a higher note vibrates more times per second and loses a little energy on every cycle, so it runs out sooner. Compensated takes that out. Each note is compared with the trend of its own string, so 1.00 is “as long as this string normally rings at this pitch”, 0.50 is half that. Green is a healthy note, red a note that gives up early.
What to look for:
- Red cells that line up across strings. A dead spot belongs to a frequency, so the same pitch tends to come out short on neighbouring strings: here F#3 (185 Hz) on the A string’s 9th fret (0.49) and the low E’s 14th (0.53), and G#4–A4 (415–440 Hz) on the high E’s 4th and 5th frets (0.65, 0.49) and the B’s 9th and 10th (0.61, 0.60). That diagonal pattern is the signature of the neck, not of your playing.
- A lone red cell is a question, not an answer. Pluck that note a few more times before you believe it.
- Look at the harmonics too. The H1 to H4 buttons show the same map for the fundamental and for the second, third and fourth harmonic on their own. A note can keep its fundamental and lose a harmonic: then it rings, but thinner.
Step 3: tap the neck
The scan says which notes die. The tap test says where the neck resonates, so you can tell whether a short note sits on a neck resonance or has some other cause.
Mute the strings first, so that only the wood rings. Clamp a damper on the strings over the body, or wedge a folded cloth under them. Then weave a rubber band through the short string ends between the nut and the tuners: they can ring too and add sharp peaks to the spectrum that are not the neck. A plucked string should give a dull thud, no pitch.
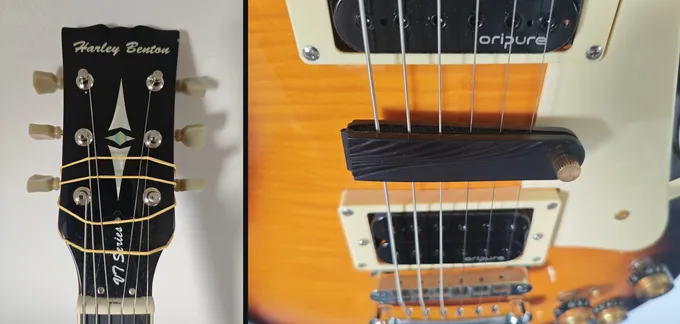
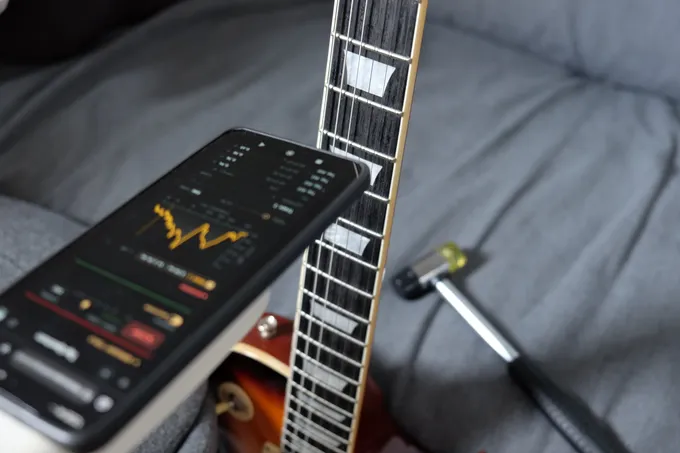
Open Tap Spectrum on the phone. The tap is recorded through the phone’s microphone, so the guitar does not need to be plugged in. The basic setup:
- Hold the guitar by the body and leave the neck free. Nothing should touch the neck but the hammer.
- Put the phone 10–15 cm from the fretboard, its microphone pointed at the 5th fret, and press Record.
- Tap the back of the neck, right behind the 5th fret, with very light knocks.
Each tap is captured as a spectrum. Knock three times or more at one spot: one tap can catch a mode badly, the average does not.
Every tap goes into the trace’s Captures list. Hover over or click a row to see that tap’s own spectrum over the chart, and delete one that went wrong, a double hit or a knock that slipped, so it does not spoil the average.
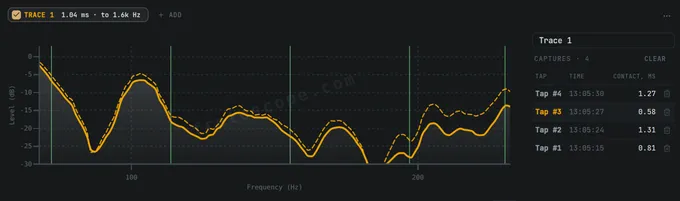
Tap at more than one place, one trace each: the 5th fret first, then higher up the neck. We also used the 10th and the 13th fret. Name each trace after its spot, so you can tell them apart later. Several spots matter because a mode is loud where the neck moves and nearly silent at its nodes. A single tap at the wrong place can miss a resonance that kills notes elsewhere on the neck.
Use the Comp curve. It divides every tap by its own knock, so taps struck a bit harder or softer can be compared. If the app finds no knock, there is no need to hit harder: the resonances are still measured, just read the Raw curve. The mode table highlights a resonance with a Q above 150: that is too sharp for wood, and something else is ringing along: a string that is not muted, the short string ends between the nut and the tuners or between the saddles and where the strings are anchored, the tremolo springs in the back, loose hardware, or mains hum at 50 or 60 Hz and its multiples. Mute or switch off what you can and tap again.
A phone is enough. Every conclusion in this article was drawn from taps recorded with a phone’s microphone. A studio microphone on the audio interface gives a better signal-to-noise ratio, though, and the neck’s modes stand out more cleanly.
Step 4: lay the scan over the tap
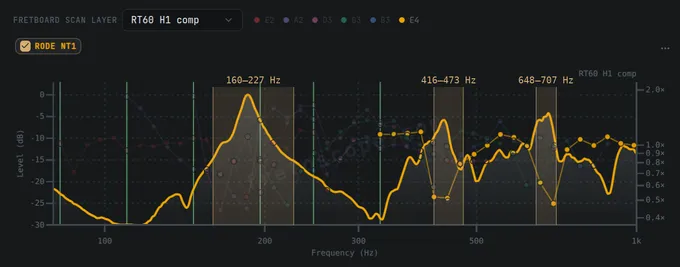
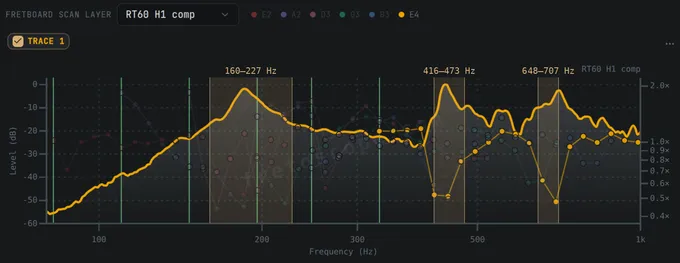
Under the tap spectrum, choose a Fretboard scan layer, for example RT60 H1 comp, and turn on one string in the legend. Every note of that string now sits at its own frequency over the tap curve, against the right-hand axis. A dead spot shows as a dip in the string right under a peak of the neck.
Here is the SC-450 struck at the 5th fret, with the high E string. We shaded the bands that Fretoscope found in the scan (step 5); the app itself draws only the curve and the notes:
And the same neck struck at the 13th fret:
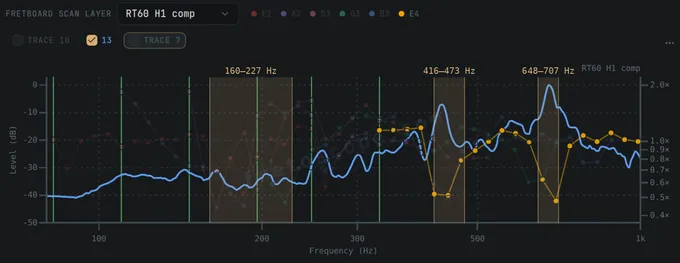
The lowest resonance, around 186 Hz, is strong when the neck is struck at the 5th fret and all but gone at the 13th. The group around 690 Hz does the opposite. That is why you tap at more than one place, and it is also why dead spots sit at some frets and not others.
Step 5: open the Dead spots card
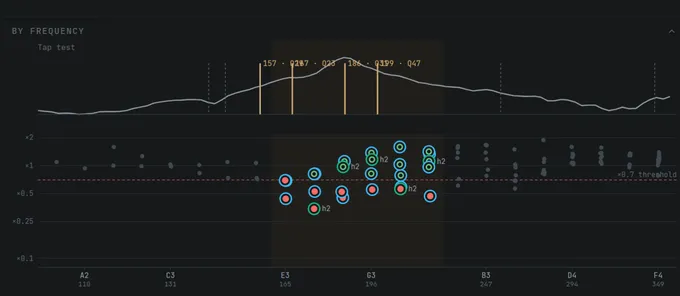
On the guitar’s page, among the findings, the Dead spots card puts it together. It treats every note and every harmonic as a probe of the neck at one frequency and one fret, and looks for frequency bands where the probes come out short more often than chance would allow. A single bad note does not make a band; a resonance does.
For the SC-450 it finds three bands: 160–227 Hz, 416–473 Hz and 648–707 Hz. Each card shows the band’s range, the notes it covers, and how far its worst probe falls: ×0.34 for the lowest band means the deepest probe in it decays at 0.34 of its trend. If the guitar has a tap test, the card draws it above the probes on the same frequency axis and highlights the neck’s resonances inside the selected band, so you can see which resonance the band sits on.
How to read a band
Pick a band, and the fretboard below shows only that band’s probes:
- A filled red cell is a dead probe, an outlined one is a probe in the band that is not dead. The number is how long it rings against its trend, so an outlined cell can still be on the short side, just not short enough to count.
- The label says which part of the note hit the band. h1 is the note itself, h2 its second harmonic (twice the note’s frequency), h3 the third, and so on. Every harmonic has its own trend on its own string, so an h3 of 0.53 means “this harmonic dies at about half the time it normally does”, whatever the note does.
- “Dead probes by harmonic” counts them: it tells you whether the band takes whole notes (mostly h1) or colours them (mostly h2 and above).
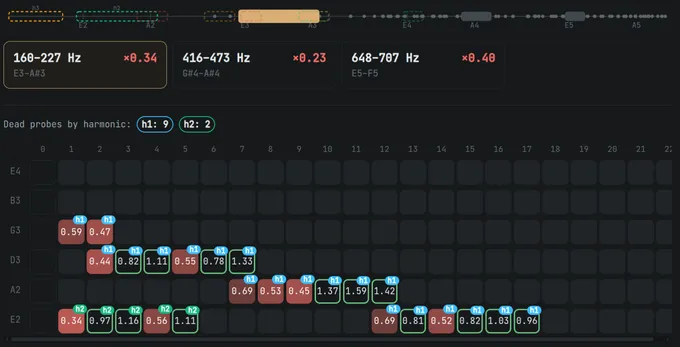
The lowest band on the SC-450 is made of whole notes: 9 of its 11 dead probes are h1. Read the outlined cells as carefully as the red ones. Below fret 10, 9 of the band’s 16 probes are dead; above it, 2 of 9. On the A string the change is a single fret wide: the fundamentals of frets 7 to 9 ring 0.69, 0.53 and 0.45 of their trend, those of frets 10 to 12 ring 1.37, 1.59 and 1.42. The card rates each harmonic on its own, so a number here can differ a little from the whole note on the map: the A string’s 9th fret is 0.49 there and 0.45 here. A healthy note inside a dead band usually means its fret sits near a node of the resonance; hover it and the card says so.
Harmonics die too
A neck resonance does not care whether the energy at its frequency comes from a note or from a harmonic of a lower note. The second harmonic of a note at 220 Hz sits at 440 Hz, and if the neck resonates at 440 Hz, that harmonic drains into the neck like a note played there would.
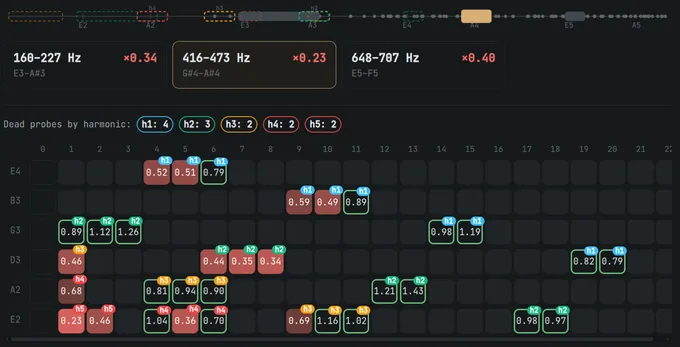
The 416–473 Hz band shows it. Of its 13 dead probes only 4 are notes played at their own pitch; the other 9 are second to fifth harmonics of lower notes. On the D string, frets 6 to 8 lose their second harmonic: 0.44, 0.35 and 0.34 of its trend. The notes themselves still ring; frets 7 and 8 even ring longer than their trend overall (1.25 and 1.54). What they lose is part of their tone: the second harmonic fades early, and the note gets duller as it sustains.
You can see the same thing on the tap. Choose the scan layer for the harmonic instead of the note, RT60 H2 comp, and every note’s second harmonic is drawn at its own frequency over the neck’s spectrum:
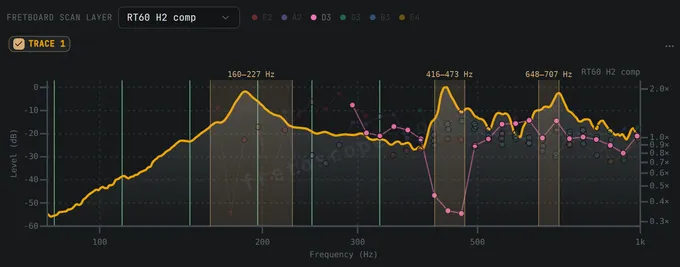
The D string’s second harmonics ring at their trend everywhere except under the 432–455 Hz peak, where frets 6 to 8 drop to about a third. Their neighbours on either side, fret 5 at 392 Hz and fret 9 at 494 Hz, ring normally (0.98 and 0.89).
What to do with the result
A map like this is a reference, not a verdict. The dead spots belong to the neck’s resonances; why they move rather than disappear when the neck changes is in the companion article. What you can do with the map:
- Check it before blaming the frets. A dead spot is often put down to a bad fret, and the fix offered is fret work. A fret problem stays with the fret: it shows at that position whatever the pitch. A resonance follows the pitch: the same note comes out short on several strings and frets, and it sits right under a peak of the tap test. If your dead notes line up like that, the frets are unlikely to be the cause, and levelling, reseating or replacing them is unlikely to bring the notes back.
- Play around them. The same pitch at another fret can ring. On the SC-450, F#3 is dead on the A string’s 9th fret (0.49) and the low E’s 14th (0.53), but on the D string’s 4th fret it rings close to its trend (0.92).
- Keep the scan. Dead spots come back scan after scan: on this guitar, two scans two months apart share 7 dead positions against fewer than 2 by chance. If something changes on the neck (new tuners, a headstock clamp, a different neck), scan again and compare: the bands move with the resonances.
Scan your guitar and see where its dead spots are.