How the Fretboard Scanner works
The question we get most about the fretboard scan is a fair one: you pluck every note by hand, so how can the numbers mean anything? One pluck is louder, the next one is softer, you hit the string a centimetre closer to the bridge. A lab would use a plucking machine.
The short answer: the scan measures things your pluck barely changes, it compares every note with the other notes you played the same way, and the results come back when you scan again. This article explains what each value means, how to record a scan, and how each value is computed, with what we measured to check it. The statistics of the actual measurements and the error calculations are in the collapsed boxes.
What the scanner measures
You pluck a note and let it ring. The scanner waits for the attack to pass and the pitch to settle, then follows the note until it has died away far enough to measure, at most about 10 seconds. From that one recording it computes the values below.
Pitch
- Cents. How far the note is from the equal-tempered pitch, in cents (a hundredth of a semitone). It includes how well you tuned the guitar.
- Cents comp. The same with the open string subtracted, which takes the tuning out.
- Cents int. One step further: the server fits each string with a model of what the saddle position and the nut do to every fret, and shows what that model does not explain: what is going on at a particular fret.
Sustain
- RT60. How long the note takes to fade by 60 dB, in seconds. It is read from the slope of the decay, not by waiting for the note to vanish.
- RT60 H1, H2, … A plucked note is a stack of harmonics: the fundamental (H1) at the note’s own pitch, then two, three, four times that frequency. Each one fades at its own rate, and the scanner measures each of them separately.
- RT60 comp. The note’s RT60 divided by what is expected from its string at that pitch: 1.0 rings as long as expected, 0.5 half as long. This is the value to read dead spots from (see Each note against its own string).
Other values
- Beating. How much the level swings up and down as the note decays, in dB.
- Inharmonicity B. How far the harmonics drift sharp of exact multiples, which tells you how stiff the string is.
- Dominant H and Longest H. Which of the first four harmonics carries the most energy, and which one rings longest.
- Buzz swing. A sign that the string rattles against something: a fret, or the nut slot or the saddle, where it gives the twangy “sitar” sound. The larger it is, the more likely the note buzzes. Sometimes it can also roughly tell where the string touches.
The scan reports how long each harmonic rings and never how loud it is. The levels of the harmonics depend on how hard and where you pick, which pickup you are on and where it sits under the string; the decay rates belong to the string and the guitar.
How to record a scan
- Record the pickup through an audio interface. Plug the guitar straight into the interface’s instrument input, with no pedals, amp or effects in between, and choose it as the input in the scanner. Effects change how the note decays. If you have no interface, the microphone of your phone or laptop will do, but the results are less accurate: a microphone also hears the room and its noise.
- Use the neck pickup, and the same one in every scan you want to compare.
- Set the sensitivity threshold above the noise floor. The slider on the Input Level meter sets the level from which the scanner hears the attack of a note. It does not have to sit right above the noise, only far enough from it that the attack of a pluck clearly stands out: watch the meter with the strings muted, then while you pluck, and put the slider in between.
- Select the string, then play its notes. Click the string’s tuning note button left of the nut and pluck one note at a time on that string, in any order. The scanner works out the fret from the pitch by itself.
- Same pick, same spot, same strength for the whole scan. Medium to light: hard enough for the high harmonics to clear the noise, not so hard that the string buzzes on the frets or starts noticeably sharp.
- Let every note ring until the spinner on its position is gone. Do not mute it with your hand: a note cut short reads short.
- Pluck each note two or three times if you have the time. The scanner averages the takes of a position. If one take was clearly wrong, muted or buzzing, open the position and delete that record.
- Read patterns, not single cells. A lone short note is a question; the same pitch short on neighbouring strings, and again in the next scan, is an answer. The same for pitch: a cent or two on one fret may be real, but it is within what one pluck scatters, so pluck that note a few more times before trusting it. A pattern over several frets is easier to believe.
How it works
How sustain is read from the decay
When a note fades, its level in decibels falls along a nearly straight line. The steeper the line, the shorter the sustain. RT60 is that slope turned into seconds: a note falling 6 dB per second has an RT60 of 10 seconds.
Reading a slope off a real note is harder than it sounds. The level wobbles as the string’s two planes of vibration beat against each other, and the tail eventually sinks into the noise of the pickup and cable. We use the method room acoustics uses for reverberation time: Schroeder’s backward integration, which sums the energy from the end of the note back to each moment. That smooths the wobble without hiding the slope. Two corrections from the same standard (ISO 3382) handle the ends of the note: the sum stops where the note meets the noise floor, so noise cannot stretch the tail, and if the note was still ringing when the capture stopped, the energy it would have had is added back.
Why the strength of the pluck barely matters
Here is the open B string of a Telecaster, plucked three times, with the level of its fundamental over time:
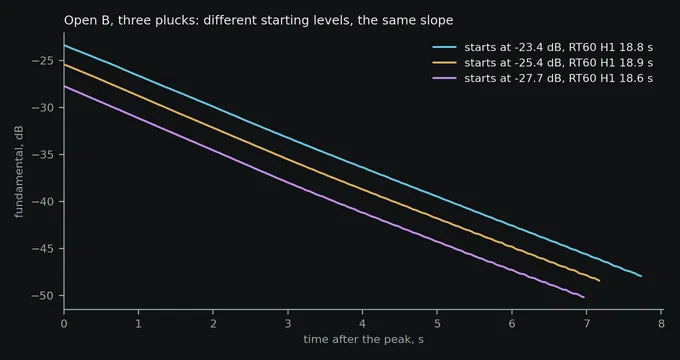
The loudest pluck starts more than 4 dB above the softest, about one and a half times the amplitude. The lines are parallel all the same: the scanner reads 18.8, 18.9 and 18.6 seconds for the fundamental.
How fast a note loses its energy is a property of the string and the guitar: the string’s own internal friction, the air, and the energy that leaks into the neck and the body through the frets, the nut and the bridge. The pick mostly decides how much energy there is to lose. A stronger pluck starts higher on nearly the same slope.
The same goes for where you pick. Plucking closer to the bridge makes the high harmonics louder; it does not change how fast each one fades.
The numbers: 50 plucks over 21 dB
“Nearly” is the honest word. We plucked the open low E of a Les Paul 50 times, from very soft to hard, at different spots along the string and at different angles, and plotted each take’s RT60 against how loud it started:
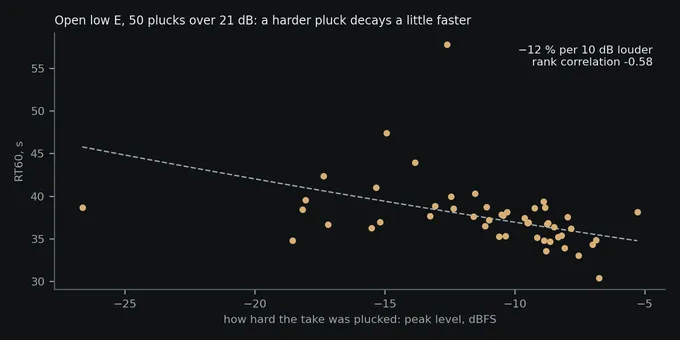
A harder pluck does decay a little faster: about 12 % shorter per 10 dB louder, with a rank correlation of −0.58. But 10 dB is a big difference, roughly three times the amplitude. Plucked evenly, within a few dB, the effect is a few per cent, smaller than the scatter between plucks below.
How much one pluck scatters
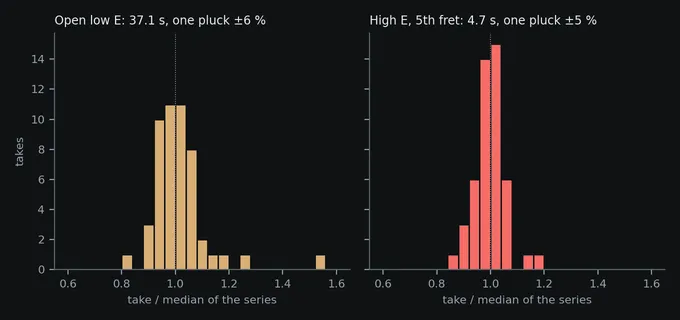
To see how much a single hand pluck moves the numbers, we plucked two notes of the same Les Paul 50 times each: the open low E, which rings for over half a minute, and the 5th fret of the high E, a dead spot on this guitar that dies in under five seconds. One pluck scatters by about ±5–6 % in RT60 on both, and by about a cent in pitch.
The numbers: histograms of 50 plucks per note
Each take is divided by the median of its own series, so a 37-second note and a 4.7-second note share one axis. The spread is the robust standard deviation (1.4826 × the median absolute deviation of the logarithm), which a few odd takes cannot inflate:
The same for the harmonics and the pitch:
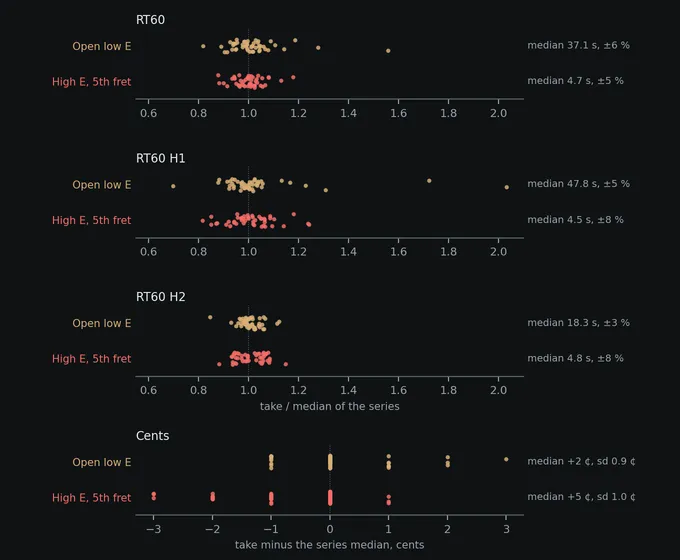
| Open low E | High E, 5th fret | |
|---|---|---|
| RT60, median | 37.1 s, ±6 % | 4.7 s, ±5 % |
| RT60 H1, median | 47.8 s, ±5 % | 4.5 s, ±8 % |
| RT60 H2, median | 18.3 s, ±3 % | 4.8 s, ±8 % |
| Cents, standard deviation | 0.9 ¢ | 1.0 ¢ |
A few takes of the open E are slow, up to 1.56 times the median, which is why the spread is measured robustly.
Each note against its own string
A raw RT60 map of a fretboard is hard to read. Low strings ring longer than high ones, and every string rings shorter as you go up the neck: a higher note vibrates more times per second and loses a little energy on every cycle. That trend is physics, not a fault, and it is far bigger than the differences worth seeing.
So when you save a scan, the server fits a trend to each string: a straight line through the notes’ RT60 against their pitch, both on a logarithmic scale. RT60 comp is each note’s RT60 divided by that line. Each harmonic gets its own trend the same way.
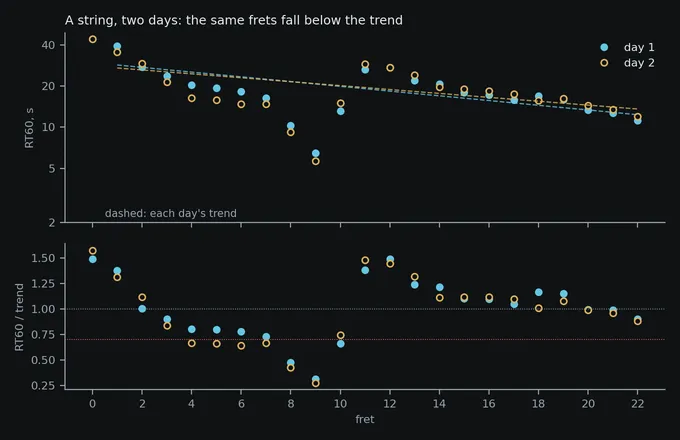
A dead spot sits much further from its trend than one pluck scatters: the dead note on the Les Paul’s high E rings at about half its trend on every single pluck.
The numbers: a dead spot plucked 47 times
The 5th fret of the high E (A4, 440 Hz) from the series above, each take divided by the high E’s trend from a scan of the same guitar three days earlier:
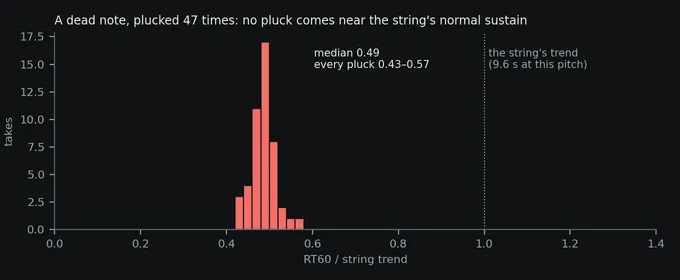
The median is 0.49 and no pluck comes above 0.57. The ±5 % of one pluck cannot turn this note into a normal one, or a normal note into this.
Why the first cents reading is higher than the final one
Watch a cell while you scan a low string: a number appears almost as soon as you pluck, often several cents sharp, and a few seconds later it is replaced by a lower one. Nothing went wrong. The string really is sharp at first.
A vibrating string is longer than a still one: it bows out to each side, and the curve between the nut and the saddle is longer than the straight line. Stretching a string raises its tension, and tension sets the pitch. So while the string swings wide it plays above its settled pitch, and as the swing dies away the pitch sinks back. The extra pitch grows with the square of the swing: twice the swing, four times the shift.
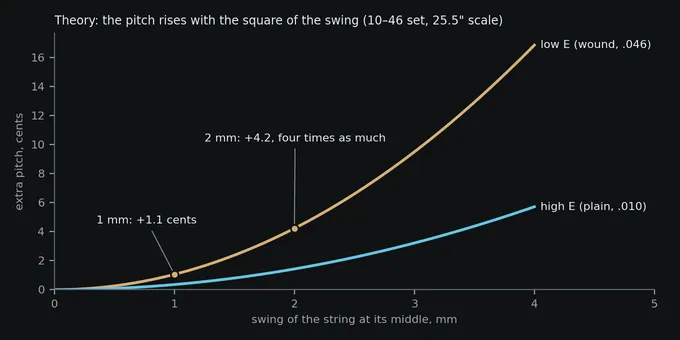
The wound low E is the most affected, which surprises people. Its steel core is the least strained string in the set (the winding adds mass, not stiffness), so the same swing stretches it proportionally more.
This is what the open low E of a Les Paul does after one pluck:
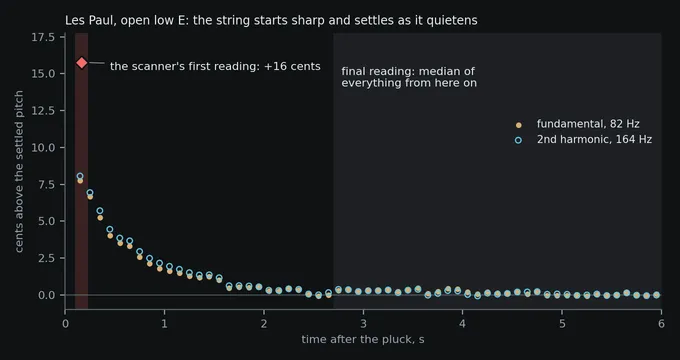
A fifth of a second after the pick, the string is about 8 cents sharp. Half a second in, 3.5 cents; after one second, 1.6; after two, the glide is over. The fundamental and the 2nd harmonic fall together, to within half a cent, which is what a change of tension does: it moves every harmonic by the same number of cents.
You can see the same thing on any accurate tuner, such as a strobe tuner: pluck hard and the reading starts sharp, slides down, and settles.
So the scanner reads the pitch twice. The first reading comes within about a fifth of a second, from a few cycles of the note, so that the cell shows straight away which note it heard. It catches the string while it is at its sharpest, and as a quick estimate it is also rougher: on the Les Paul’s open low E above it read +16 cents while the string itself was at +8. The final reading throws away the first 2.4 seconds after the note has settled and takes the median of the pitch over the rest of the note. That is the number you keep, and the one every pitch value in the report is built on.
The numbers: first against final reading on three guitars
Across whole scans, the gap between the two readings depends on how hard the strings were plucked:
- Les Paul: the first reading was higher on all 138 notes, by a median of 7.3 cents and up to 21 on the low E. At the moment it was taken, the strings were themselves a median of 3.9 cents sharp.
- Stratocaster: 6.6 cents higher at the median, with the strings 1.8 cents sharp.
- Telecaster, a scan played more gently: 0.7 cents, and no glide to speak of.
On long bass notes the final reading cannot quite get rid of the glide either. An open low E can stay loud for the whole recording, and a string that is still loud is still a little sharp: four or five of the lowest notes per guitar read 1 to 3 cents sharp even in the final reading. Pluck the scan with a medium-to-light, even hand and this stays small.
Does it repeat?
The real test of a hand-played measurement is to do it again. We scanned the same Telecaster on two days, with the same strings and nothing touched in between, and compared all 138 positions:
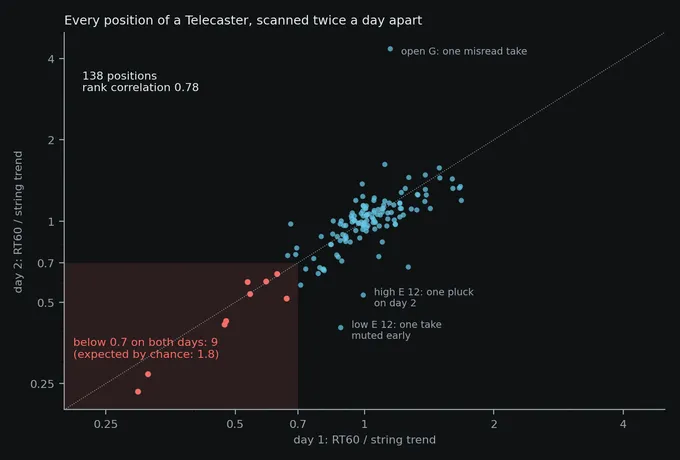
The short notes of the first day are the short notes of the second. The same pitches coming out short on neighbouring strings is the signature of a resonance in the guitar, not of a bad pluck (see Guitar dead spots live on your neck’s resonances).
So why not a plucking machine?
A machine would make every pluck the same: the same force, the same point, the same angle. That would help with exactly one thing the scan does not report, the levels of the harmonics, which depend on where and how the string is plucked. For the decay rates and the trend comparison the scan is built on, the variation between hand plucks is small, and the repeat above shows how small.
What a machine would cost is the playing conditions. To pluck and fret 138 positions it has to hold the guitar in a fixture and press each string with something other than a finger. Dead spots come from the neck vibrating, and how the neck is held and loaded is part of what it does. The study that mapped dead spots on electric guitars and basses fret by fret, Helmut Fleischer and Tilmann Zwicker’s Dead Spots (Universität der Bundeswehr München, 1996), had an experienced player play the guitars standing, on a strap, with a pick and the neck pickup, each position twice, to keep the conditions of normal playing.
So a plucking machine is not needed. How fast a note decays belongs to the guitar, one hand pluck scatters by a few per cent, and a scan played by hand comes back the same the next day. Anyone with a guitar and an audio interface can get results that compare from one scan to the next and learn what their own instrument does: where it rings, where it goes dead, and what changes when you change the strings, the setup or a part such as the nut or the bridge.
Scan your guitar. For a worked example of reading the result, see How to measure guitar dead spots and find the cause.